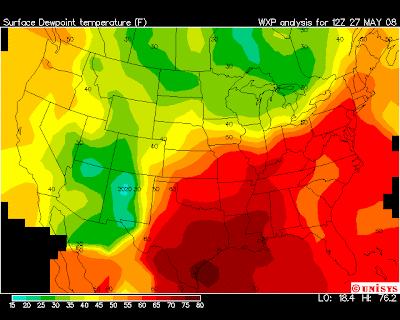
Isoline maps are another type of thematic map. Isoline maps use line symbols to portray a continuous distribution such as temperature or elevation. Isolines are lines that connect points of equal numeric value. A contour map showing elevation above sea level is a type of isoline map. The map above shows the surface dew point temperature in the


No comments:
Post a Comment