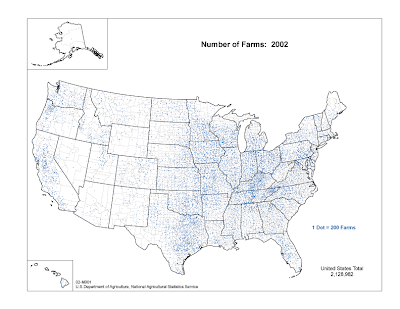
Dot-distribution maps show representations of various quantitative data found within the boundaries of a certain area. Dot-distribution is a form of a thematic map representing usually one specific geographical attribute about an area like population. The map above represents the number of farms in each state in the


No comments:
Post a Comment