Flow maps show the movement of objects such as people migrating from one location to the other or the movement of goods being imported or exported. Flow maps, or flow charts, are often used in work places to show the output of materials or work through an organization. The map above shows the pyroclastic (lava) flow and surge deposits from the June 25, 1997, dome collapse and explosion event at Soufriere Hills volcano,
Saturday, May 31, 2008
Flow Maps
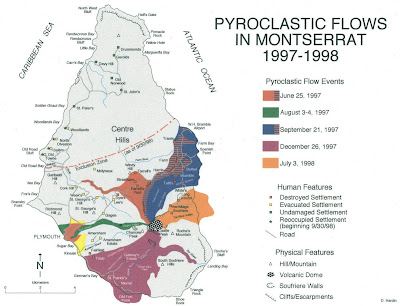
Flow maps show the movement of objects such as people migrating from one location to the other or the movement of goods being imported or exported. Flow maps, or flow charts, are often used in work places to show the output of materials or work through an organization. The map above shows the pyroclastic (lava) flow and surge deposits from the June 25, 1997, dome collapse and explosion event at Soufriere Hills volcano,
Subscribe to:
Post Comments (Atom)
No comments:
Post a Comment