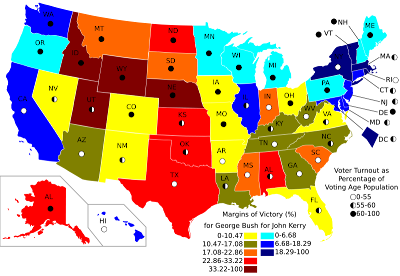
Choropleth show measures of geographic variables like population density, race or per-capita income using shades or patterns. Choropleth maps are similar to thematic and statistical maps. Choropleths are the preferred maps for depicting electoral statistics. For example, the map above depicts voter percentage difference in 2004 US presidential election as related to voter turnout. States are shaded to not only show which candidate won the state, but by how high a percentage.


No comments:
Post a Comment