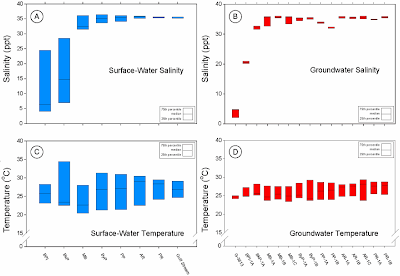
A box plot is a convenient way of graphically depicting groups of numerical data through their five-number summaries (the smallest observation, lower quartile (Q1), median (Q2), upper quartile (Q3), and largest observation). A box plot may also indicate which observations, if any, might be considered outliers. The box plot was invented in 1977 by the American statistician John Tukey. This box plot shows the groundwater characterization and assessment of contaminants in marine areas of Biscayne National Park.


No comments:
Post a Comment