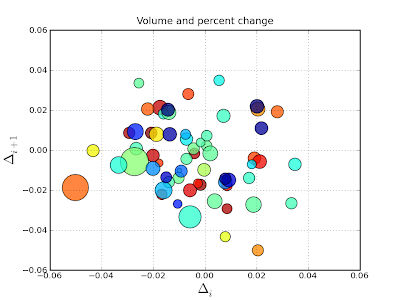
Scatterplot is a type of display that contains one or more scatter plots each of which use Cartesian coordinates to display values for two variables for a set of data. The data is displayed as a collection of points, each having the value of one variable determining the position on the horizontal axis and the value of the other variable determining the position on the vertical axis. This is an example of a scatter plot with (optional) size and color arguments. This example plots changes in Intel's stock price from one day to the next with the sizes coding trading volume and the colors coding price change in day 1.


No comments:
Post a Comment