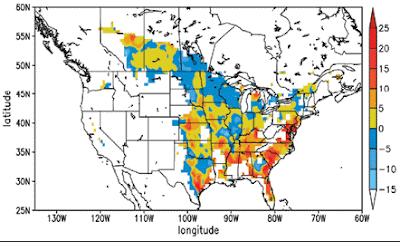
Bilateral graphs show increases on one side of a zero line and decreases on the other side. Use bilateral graphs whenever data to be presented have both positive and negative values. In this bilateral graph, positive and negative values (in %) indicate an increase or decrease, respectively, in soil carbon sequestration occurring between 1981 and 2000 because of changes in climate and the atmospheric CO2 concentration.


No comments:
Post a Comment