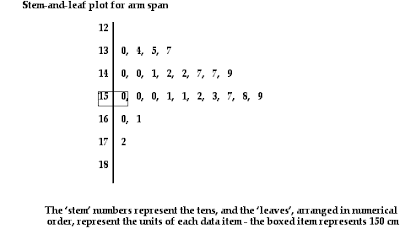
Stem and leaf plot presents quantitative data in a graphical format. They evolved from Arthur Bowley's work in the early 1900s, and are useful tools in exploratory data analysis. A basic stem plot contains two columns separated by a vertical line. The left column contains the stems and the right column contains the leaves. Unlike histograms, stem plots retain the original data to at least two significant digits, and put the data in order.


No comments:
Post a Comment