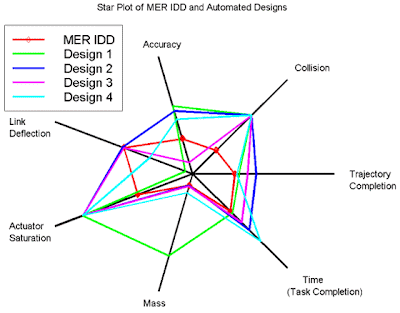
Star plots display multivariate data. Each star represents a single observation. Typically, star plots are generated in a multi-plot format with many stars on each page and each star representing one observation. In this star plot, the center represents the most desirable results. The red line represents the handcrafted MER IDD, and is used for comparison and validation of the approach.


No comments:
Post a Comment