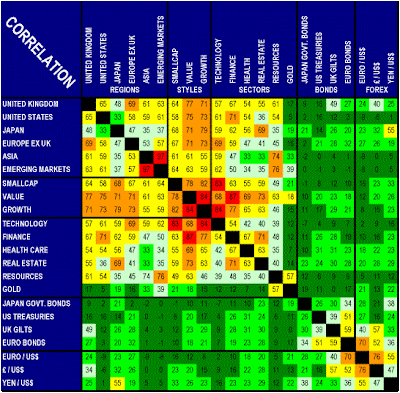
A correlation matrix is a table that can show multiple correlations among multiple cases. This correlation matrix shows the relationships between the principal bond and forex markets as well as equity regions, sectors and investing styles for which Investors RouteMap generates recommendations. Correlation is defined as the proportion to which one market reacts in sympathy with another as measured by monthly price changes in market indices measured in U.S. dollars over the past 15 years. Acute danger is color-coded in red and indicated by high numbers approaching 100%. Falling danger levels are color-coded in the red to green spectrum. Low and negative numbers color-coded in green indicate minimal danger of correlation.


No comments:
Post a Comment