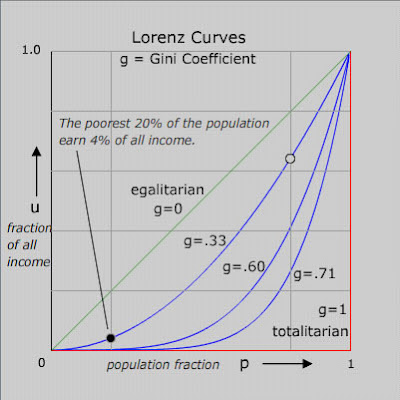
Accumulative line graph or Lorenz curve is a graphical representation of the cumulative distribution function of a probability distribution. It was developed by Max O. Lorenz in 1905 for representing income distribution. A set of idealized Lorenz curves are shown in the figure. The sloping straight green line is the Lorenz curve of an idealized perfectly egalitarian society - where everybody has exactly the same income. The red Lorenz curve - horizontal and then vertical - is that for the extreme authoritarian or totalitarian society where one person has all the income. Curves for societies with intermediate income distributions are shown. The meaning of the curves is illustrated by giving the meaning of one point (black) on one of the curves. The open circle point on the same curve has the coordinates: 80% of the population earns 64% of the income.


No comments:
Post a Comment